


在Matlab如何绘制图函数plot()呢?下面就为大家分享Matlab绘制图函数plot()的详细方法,有需要的可以来了解了解哦。
Matlab绘制图函数plot()的详细方法

plot(x) 当x 为一向量时,以x 元素的值为纵坐标,x 的序号为横坐标值绘制曲线。当x 为一实矩阵时,则以其序号为横坐标,按列绘制每列元素值相对于其序号的曲线
例如:此处用
x=0:pi/20:2*pi;
y1=sin(x);
plot(x,y1);
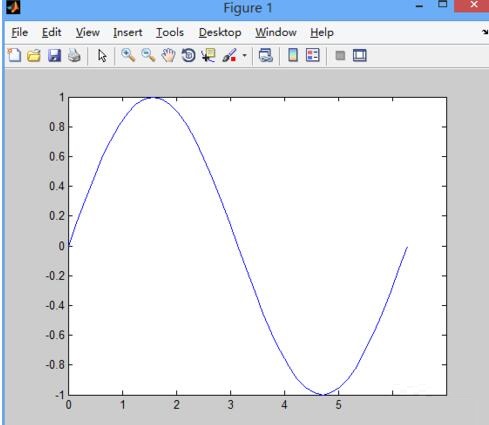
1, plot(x,y) 以x 元素为横坐标值,y 元素为纵坐标值绘制曲线。
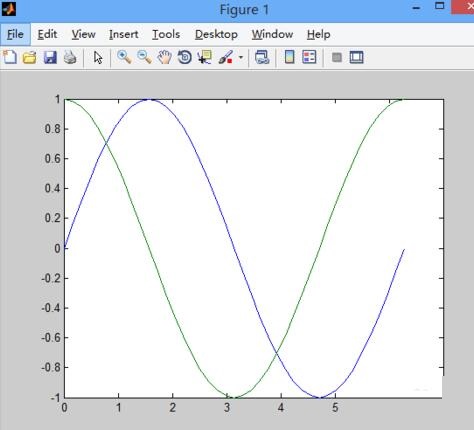
2, plot(x,y1,x,y2,…) 以公共的x 元素为横坐标值,以y1,y2,… 元素为纵坐标值绘制多条曲线。
x=0:pi/20:2*pi;
y1=sin(x);
y2=cos(x);
plot(x,y1,x,y2);
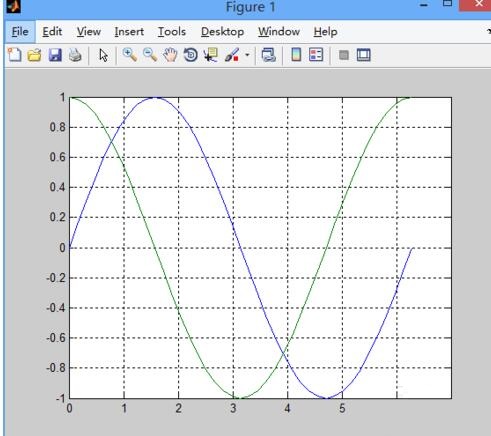
可以在画的图像中添加栅格,用命令grid on,这样可以方便你对齐某条线或是对比比较方便,看下图可以上图对比,看下有什么不同,测试代码如下:
x=0:pi/20:2*pi;
y1=sin(x);
y2=cos(x);
plot(x,y1,x,y2);
grid on
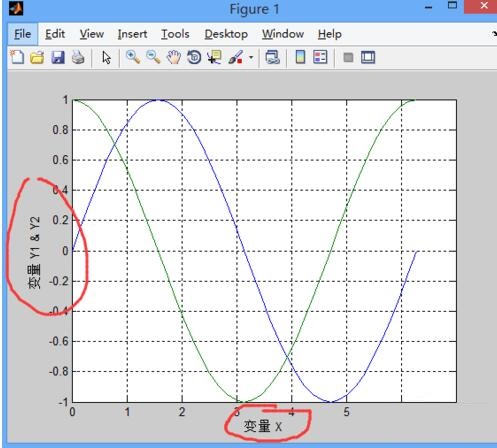
添加坐标轴信息,这样做可以很快的让人明白你在做什么,测试代码如下
x=0:pi/20:2*pi;
y1=sin(x);
y2=cos(x);
plot(x,y1,x,y2);
grid on
xlabel('变量 X')
ylabel('变量 Y1 & Y2')
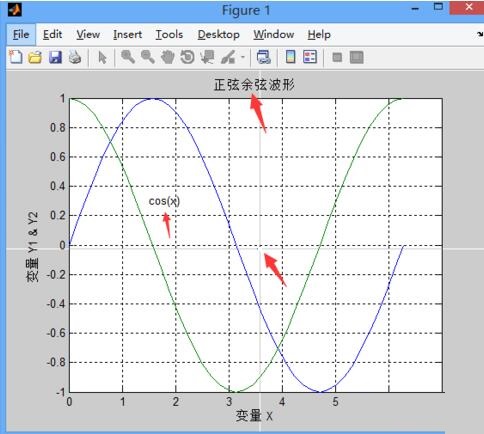
除了坐标轴信息外还可以添加其它的信息,如所画曲线的信息等:测试代码如下
x=0:pi/20:2*pi;
y1=sin(x);
y2=cos(x);
plot(x,y1,x,y2);
grid on
xlabel('变量 X')
ylabel('变量 Y1 & Y2')
title('正弦余弦波形') %添加图像标题
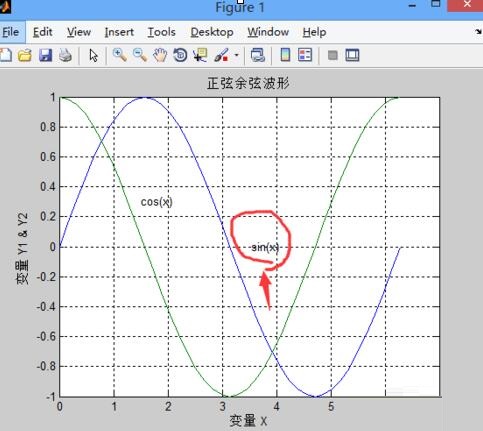
text(1.5,0.3,'cos(x)') %将cosx这个注解加到坐标中的某个位置
gtext('sin(x)') % 用鼠标的光标定位,将sinx这个注解放在你鼠标点击的地方
通过各图的对比,你就会发现这些命令的用法
上文就讲解了Matlab绘制图函数plot()的详细操作过程,希望有需要的朋友都来学习哦。