


很多的用户都在使用Eviews做数据分析,不过你们知道怎么完成回归分析吗?下文就是关于Eviews完成回归分析的具体步骤,希望大家喜欢。
Eviews完成回归分析的具体步骤

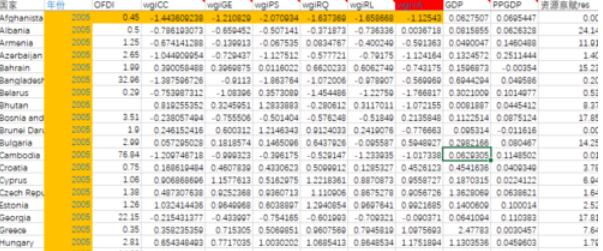
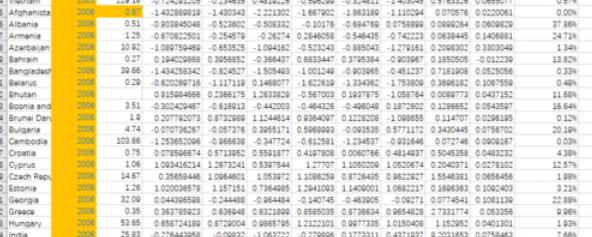
首先我们要先处理好我们的数据。如果是按时间循环的数据,例如不同国家在某几年的各个指标这种数据,我们做好按年份来将他们分类,如下图。图上表示的是按年份排列的各个国家的变量数据。
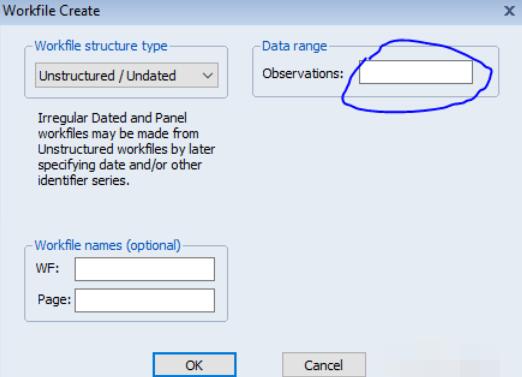
然后,关键的步骤来了,就是如何将数据导入到eviews中。首先,我们按顺序点击file》new》workfile,得到下面的窗口。
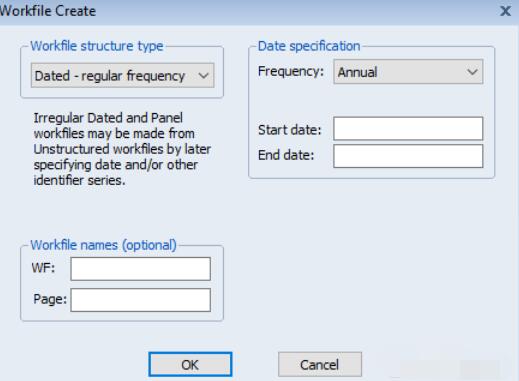
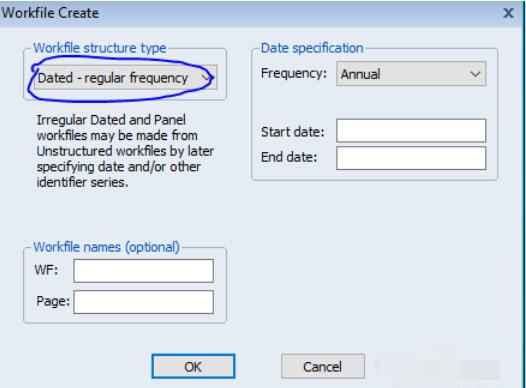
在蓝色标记的选项中下拉选择:unstructured,这代表你的数据是没有定义格式的,如果你的数据是有格式的就选择其他选项,方法一样。
在蓝色标记处输入你的数据数量,意思是你的数据在excel中有多少行。
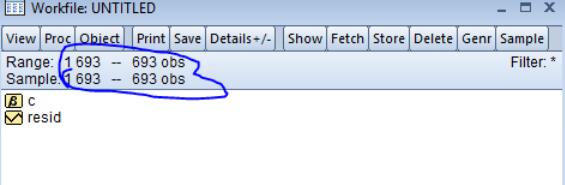
得到下表
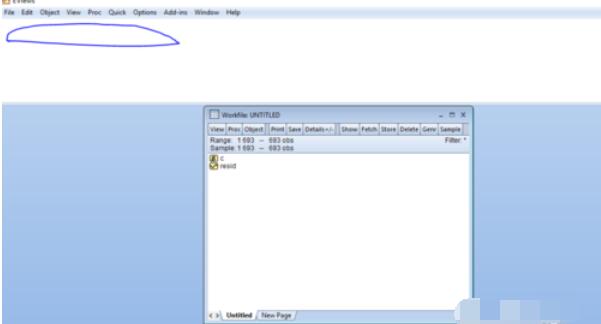
然后,在标记处输入命令:
data y x1 x2 x3 x4 x5 x6 x7 x8 x9 x10 x11 x12,然后按enter键。
y表示因变量,x1,x2···表示自变量,这些变量个数与excel中的变量对应。
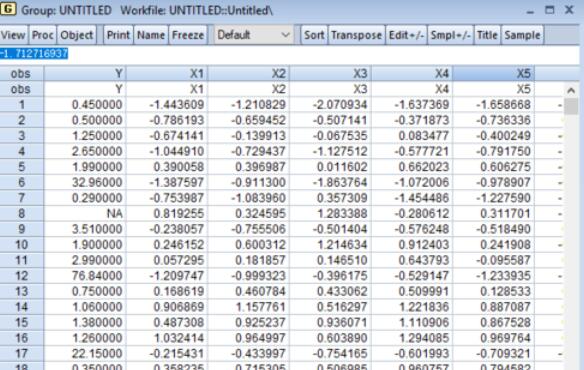
得到下图,是不是觉得很像excel的表格,哈哈
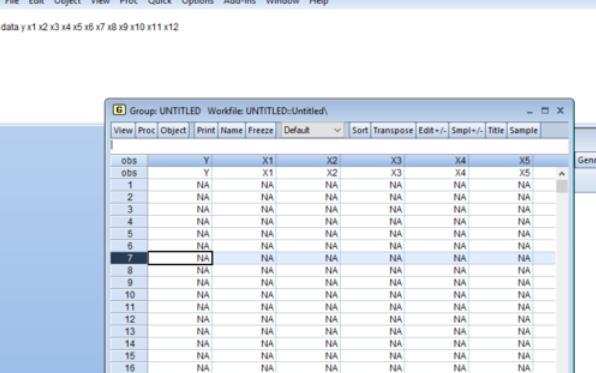
下一步就按列把数据复制粘贴进去。如图
下一步,在命令行输入:
ls y c x1 x2 x3 x4 x5 x6 x7 x8 x9 x10 x11 x12,然后按enter键。
c代表常数项,ls代表最小二乘法回归,第一个变量y表示因变量。其他就是上面列举的变量。得到下图

上面就是Eviews完成回归分析的具体步骤,希望可以帮到大家,谢谢。